
One of the great features of WebSpy Vantage is its complete flexibility over your report content. Although, Vantage is commonly used for reporting and analytics on internal web activity using log files from secure web gateways, content filtering devices and proxy servers, it is a generic log file analysis platform, and is perfect for extracting the useful information buried within any log file.
To demonstrate, I’ll walk through the process of using WebSpy Vantage to create a comprehensive Remote Desktop Report by extracting information about remote desktop sessions (RDP) from your firewall log files. I’m using Firewall logs from Microsoft Forefront TMG, but you could just as easily use logs from other firewalls, such as the packet filter logs from Sophos UTM, or connection end events from Cisco ASA. The general process is the same.
The Reporting Process
First of all, think about what information you’d like to see. In the case of RDP sessions, I’d like to see a table with the following columns:
- Source user and/or IP
- Destination IP
- Connection Time
- Size in/out during the connection
Once we know what to extract, we can create a report template in WebSpy Vantage that creates the above table.
Secondly, we need to identify a value in our log files to filter the report by. In the case of RDP sessions, this could be Destination Port 3389, or perhaps there is an ‘Application’ or ‘Protocol’ field in the log that identifies RDP. When we have identified these values (use the Summaries tab in WebSpy Vantage to browse around your data), we can apply the filter to the report template.
Finally, we need to test the report template by generating the report on our storage that contains our firewall log data, and modify the report template as required.
Let’s get started!
Step 1. Create a Remote Desktop Report Template with the required Table Columns
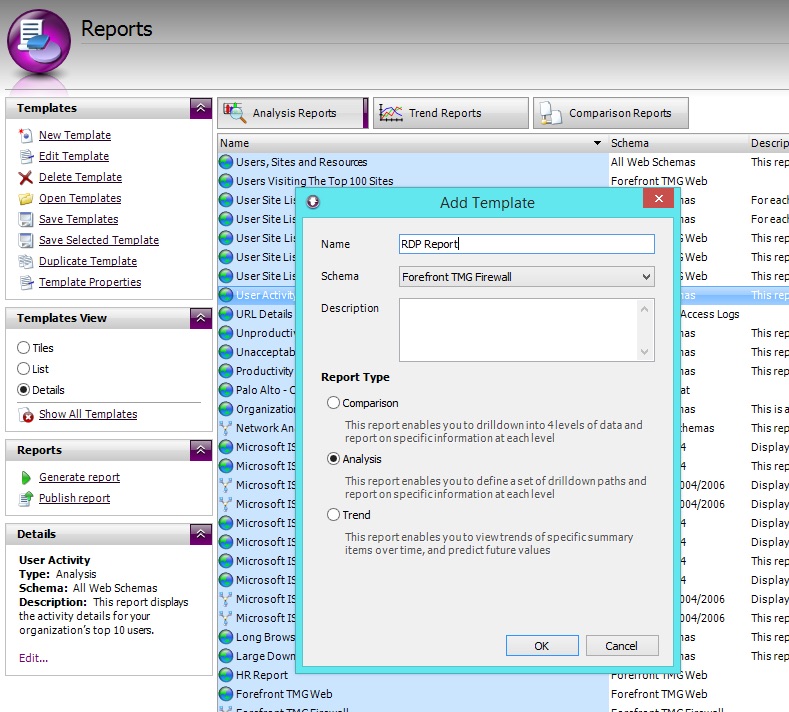
Go to the Reports tab, and click New Template. Ensure your firewall schema is selected (in my case this is Forefront TMG Firewall), and name the report RDP Report. Also ensure Analysis Report is selected.
Once the report template is created, you’ll be taken into the editing interface, which at this stage will be completely blank.
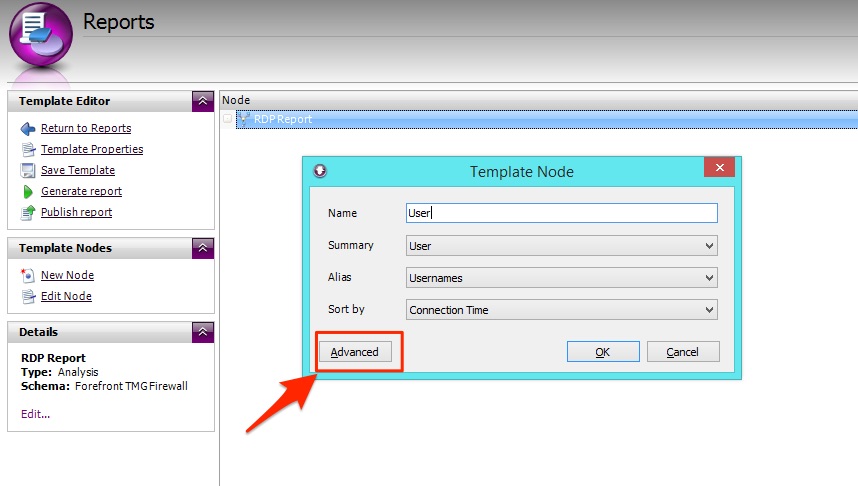
Click New Node to show the new node dialog. Select:
- Summary = User
- Alias = Usernames (this aliases the logged authenticated usernames into ‘real people’ if you have imported your organization from Active Directory on the Organization tab)
- Sort By = Connection Time
- Name: Users
The New Node dialog is great for quickly adding a node (block of report content with a table and chart) with simple default settings. But we identified a few more columns that we’d like to see in the RDP Report, so let’s click Advanced.
The Advanced Node editor presents more options such as customizing the columns and chart settings, applying filters, and cutting the table off at the top ‘n’ (such as top 50) etc.
There are two types of Columns that you can add to your report templates. Key Columns and Aggregate Columns. Aggregate columns are anything in your log that can be aggregated (summed up), such as size, times (for browsing time etc.), and hits (number of matching log lines). Key columns are everything else – values that cannot be aggregated such as Usernames, Firewall Rules, IP addresses and so on. These values can be grouped using aliases (IPs into subnets, usernames into departments etc), but not aggregated. For every unique key value, a new row will be created in the table.
If the only key in your table is Usernames, then you’ll see a row for each username. If you have a key for Usernames and another key for Source Address, you’ll have a new row for each unique combination of Username and Source IP.
For our Remote Desktop Report, we want to see a row for each unique combination of Username, Source IP and Destination IP. The other values such as Connection Time and Size in/out are aggregated per row.
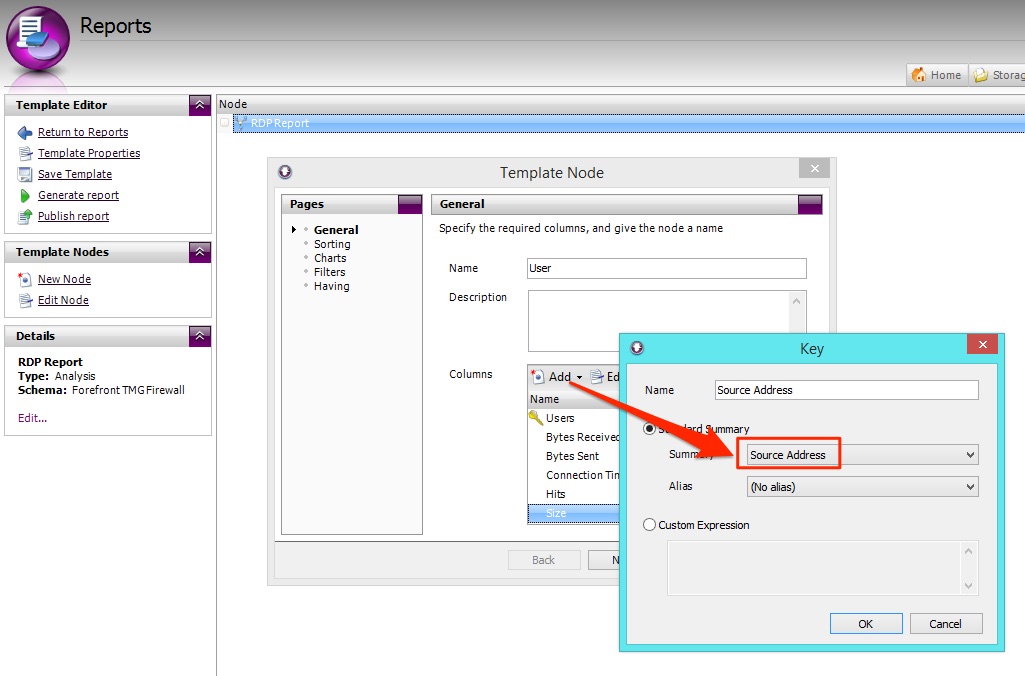
- On the General page in the Columns section, click Add | Key.
- Select Summary = Source Address and click OK.
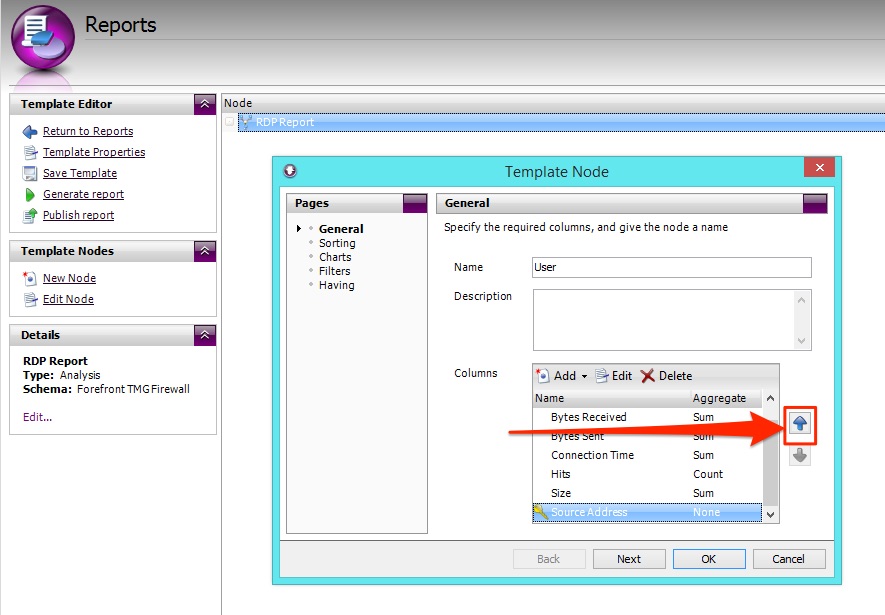
The new column is added to the bottom of the list, appearing at the far right of the table when the report is created. So let’s push it up to underneath the Users column.
Now that we have a new column showing the Source Address for each user, repeat this process for Destination Address
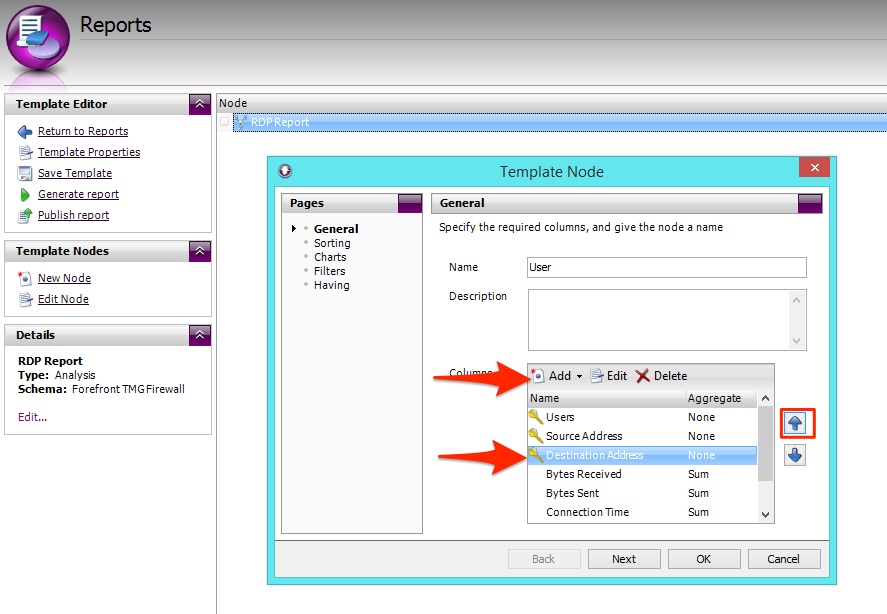
Click OK to to commit the changes to your Node.
This node will create a table and chart with a row for each unique combination of Users, Source Address and Destination Address. For each row, the table also aggregates Bytes Received, Bytes Sent, Connection Time, Hits and Size (total of bytes sent and received). These default aggregate columns are for the Forefront TMG Firewall schema, and will vary for your firewall log format.
Step 2. Identify Filter Values to extract only RDP Traffic
Typically, firewall log files contain fields for Source and Destination IP addresses along with Source and Destination Ports at a minimum. Modern ‘Next Gen’ firewalls may include an Application field, and others may log Protocol fields.
It would make sense to filter your report on Protocol ‘equal to’ RDP, however what if the protocol field only contains values such as TCP and UDP? It is therefore important to browse your log data and identify the fields to use and more importantly, what values you can hook into in order to filter your logs by RDP traffic.
The best way to browse your log data is using the Summaries tab in WebSpy Vantage.
- Go to the Summaries tab and click New Analysis
- Select the Storage that contains your firewall log files, and select the Schema that contains your firewall data (if your log creates multiple schemas). Click Next.
- Ensure Ad-hoc Analysis is selected and click OK to run the Analysis.
- Click through the Summaries looking for fields that could identify RDP traffic such as Destination Port, Protocol, Application and so on.
- Use the Find feature to search specific Summaries for values, such as 3389 or ‘RDP’.
Forefront TMG log files have Destination Port, as well as an Application Protocol field. In the screenshot below, I’ve drilled down into Destination Port 3389 and selected Application Protocol to see that this traffic is logged with Application Protocol Equal to RDP (Terminal Services) Server.
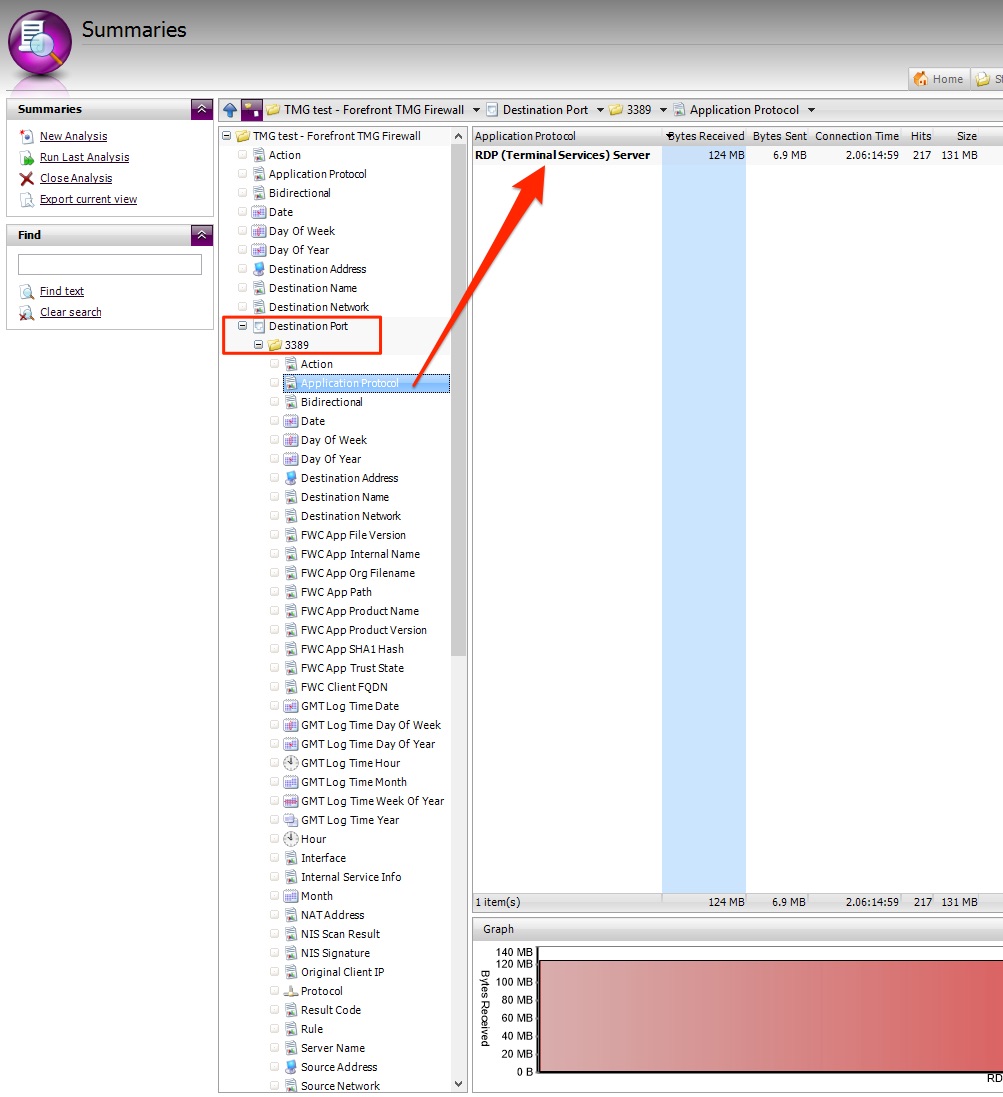
I could choose either one of these fields to filter my report by, but I’m going to choose Destination Port ‘Equal to’ 3389. I’m more confident that this value will not change, where as the Application Protocol value ‘RDP (Terminal Services) Server’ could potentially change due to regional settings or future updates.
Apply the filter to your Report Template
Now that the filter value has been identified (Destination Port ‘Equal to’ 3389), let’s apply it to our RDP report template.
Filters can be applied to each node in the report template. But since this entire report will be about RDP, let’s add the filter to the report template’s global properties. That way, any other nodes we decide to add to the template will already be filtered by RDP.
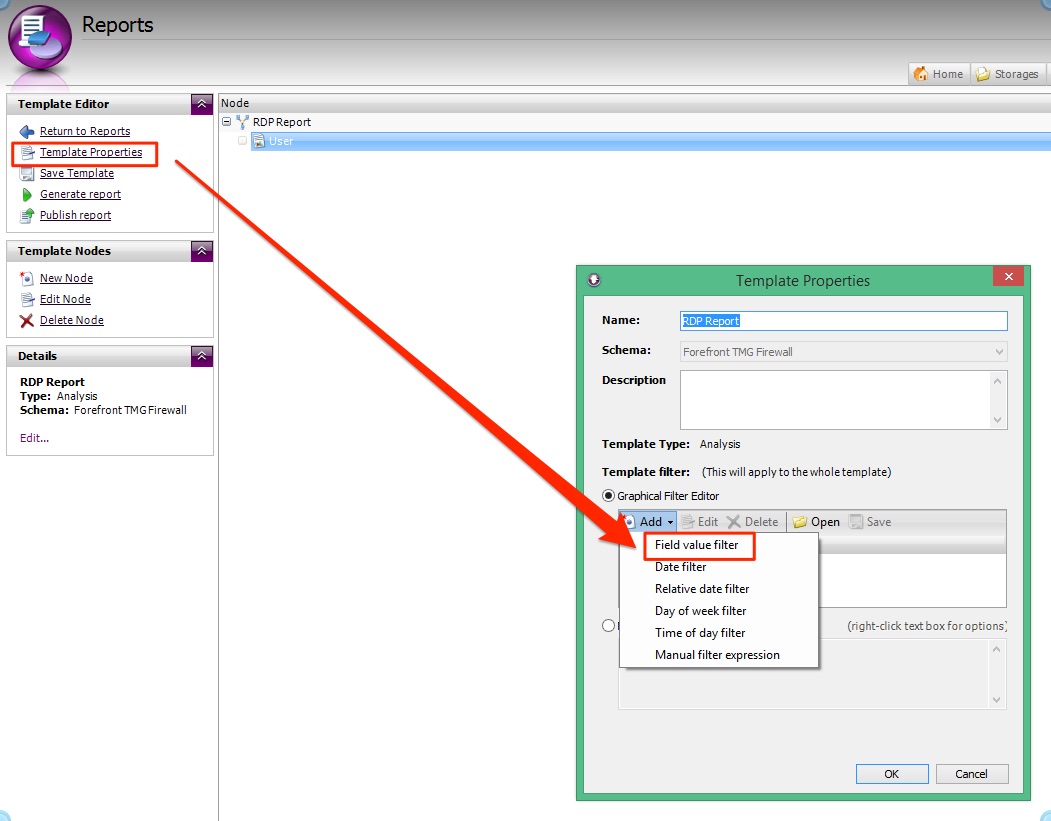
- Go back to the Reports tab and edit your RDP Report template.
- Click Template Properties
- Click Add | Field Value Filter
As previously identified, we need to filter the report by Destination Port ‘Equal to’ 3389. Therefore, select Summary = Destination Port, ensure the Include radio button is selected, and Add 3389 as a value.
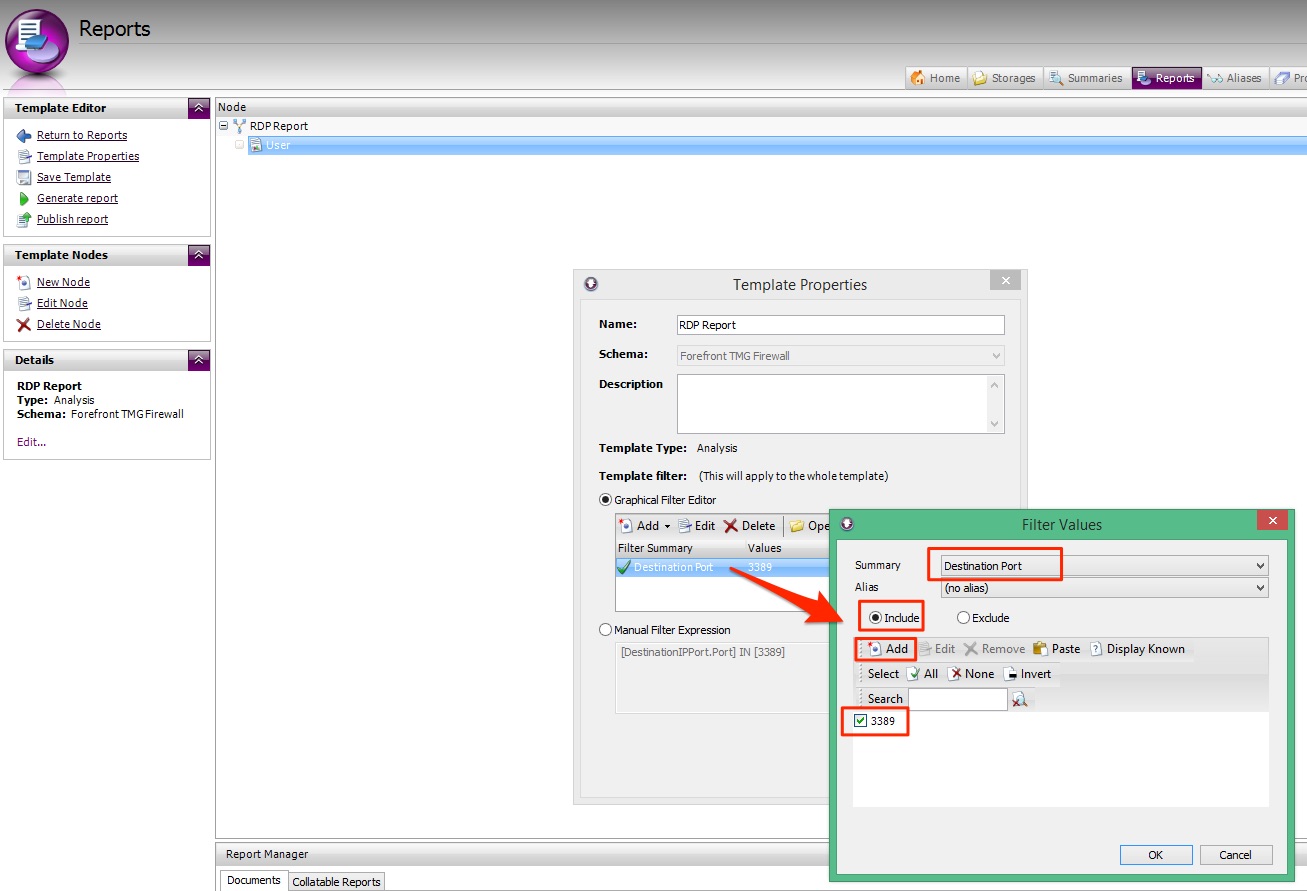
Click OK, and OK again to bake the RDP filter into the report template’s properties.
Step 3. Run the Remote Desktop Report and make modifications
Now for the fun part. Let’s generate the report on our firewall data to see what it returns!
- Ensure you still have your report selected on the Reports tab, and click Generate Report
- Proceed through the report wizard selecting your storage, report format (try Web Document (HTML, loose files)). Click OK to generate the report.
Tip: Do not add any other filters when running the report, other than Date filters that you know exist in your storage. Introducing other filters such as username filters may produce blank reports and extra troubleshooting steps. At this stage, we just want to know if the report is returning the information that we need.
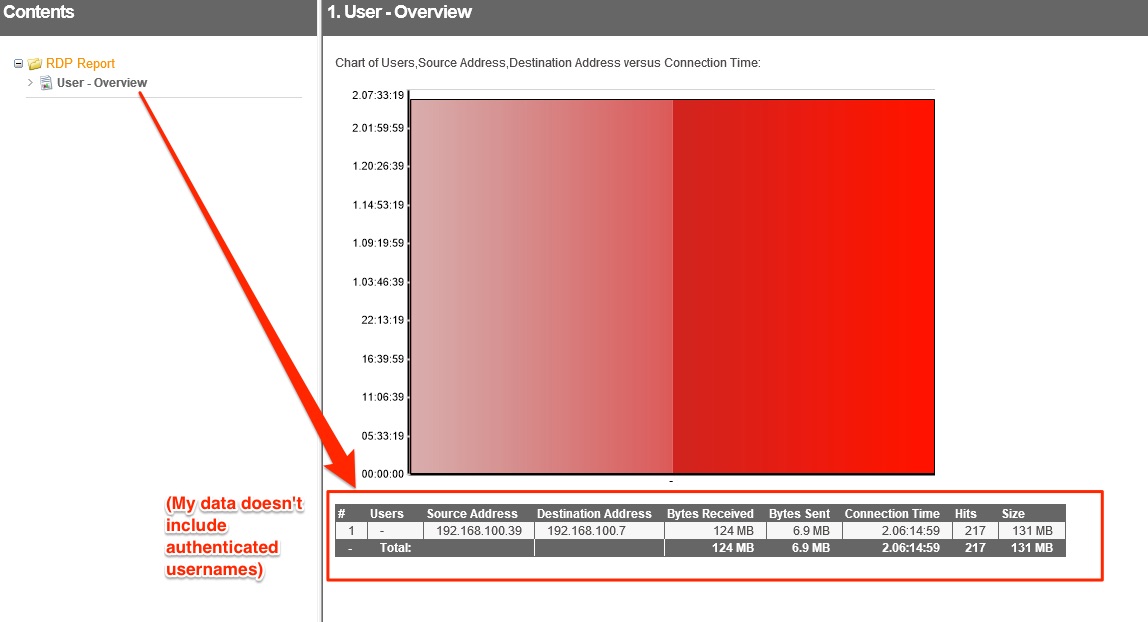
OK! It looks like I only have one user doing any sort of RDP activity in my network. There’s therefore only one row in the table and only one item in my chart – hence the huge single column.
It also looks like the Users column is blank, meaning my firewall is not logging an authenticated username for this activity.
However, I can clearly see that 192.168.100.39 has had an RDP session to 192.168.100.7 for 2 days, 6 hours, 14 minutes and 59 seconds.
First Modification – Show RDP Start and End Times
Looking at this report, it would be useful to also see the start time and end time of each connection. Fortunately, WebSpy Vantage has two useful aggregate columns that extract the first timestamp and the last timestamp for each row in your table.
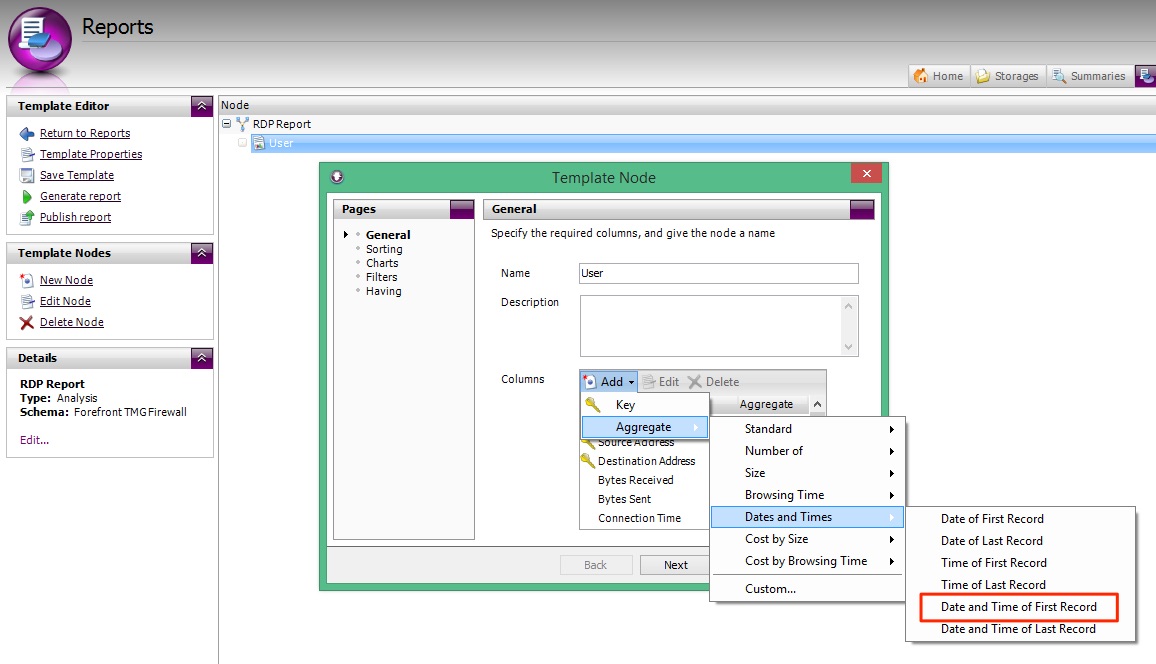
- Back on the Reports tab, edit your RDP Report Template and double-click your User node
- On the General page, click Add | Aggregate | Dates and Times | Date and Time of First Record.
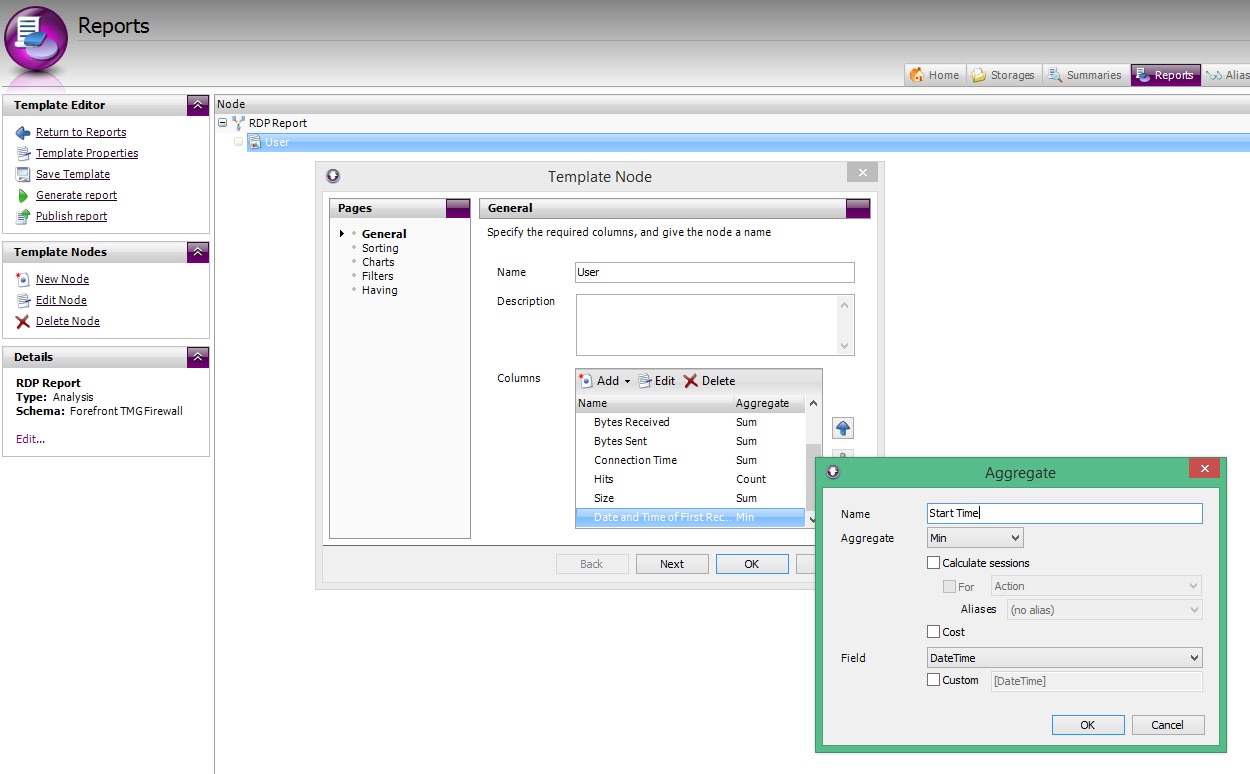
Again, this new column is added to the bottom of the column list. As ‘Date and Time of First Record’ is a bit of a mouthful, rename this column to ‘Start time’. Simply double-click the column to edit.
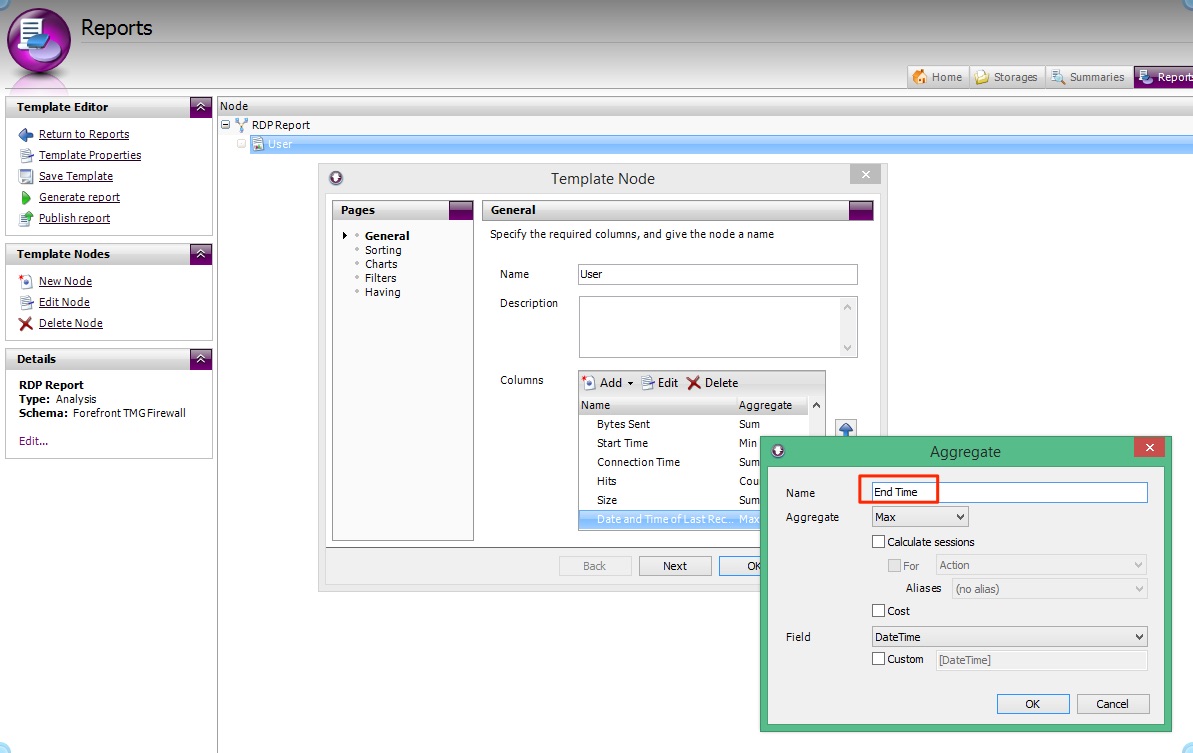
Now add a column for End Time, by selecting Add | Aggregate | Dates and Times | Date and Time of Last Record.
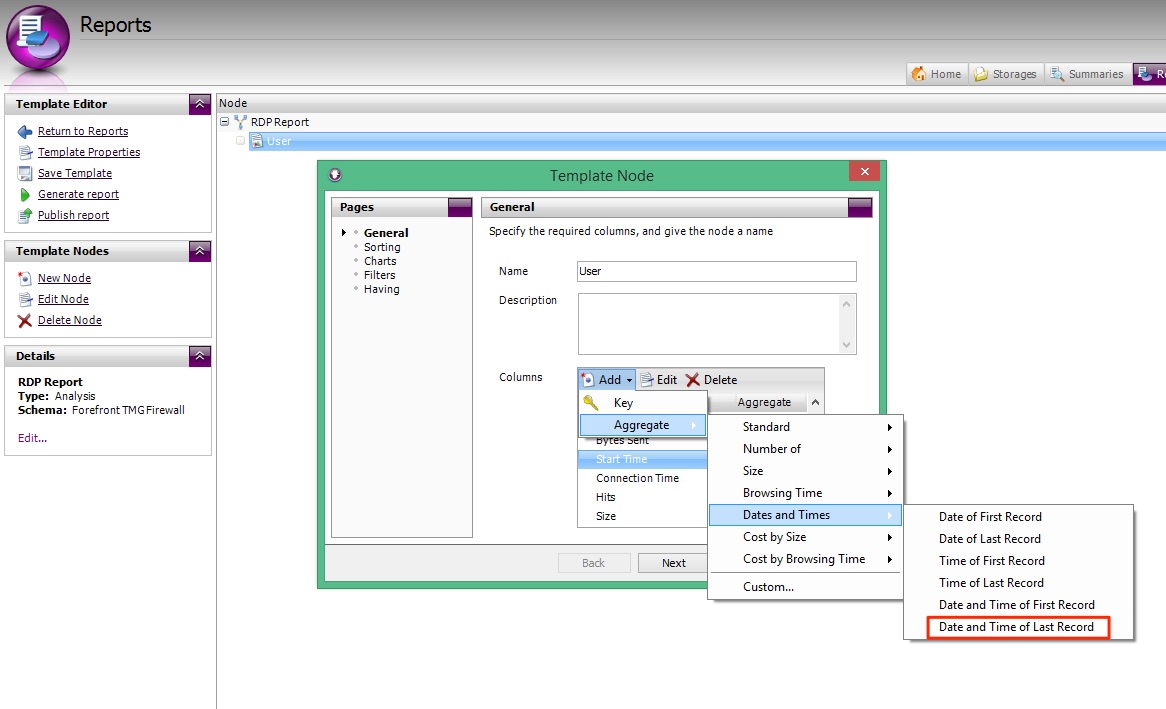
Rename the column to End Time.
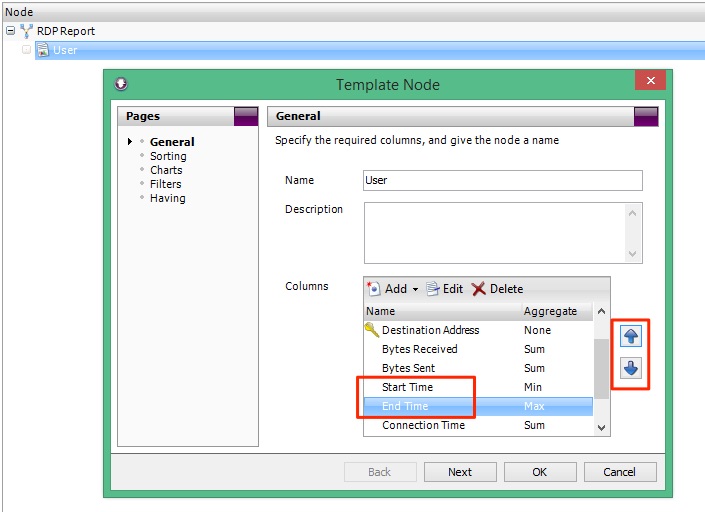
Push both Start and End Time columns up above Connection Time.
Now that Start Time and End Time have been added, run the Report again by clicking Generate Report.
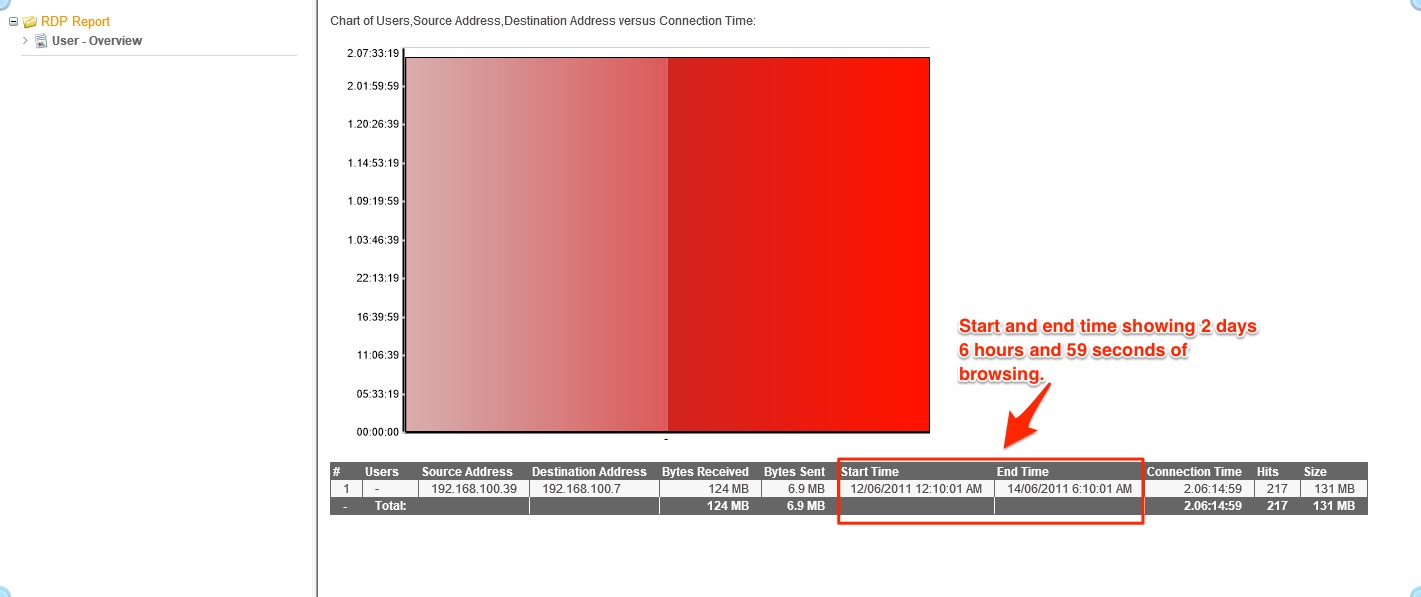
Great! Now we can see that the session started at 12.10.01 am on the 12th, and finished at 6:10:01 am on the 14th.
Second Modification – Show RDP Connections Per Date
The Start and End Times are a great addition, but now I’m curious about what happened within each date.
Let’s add a Date key column to the table to force a new row for each date, and let’s get rid of that pesky chart while we’re at it.
- Back on the Reports tab, edit your RDP Report Template and double-click your User node
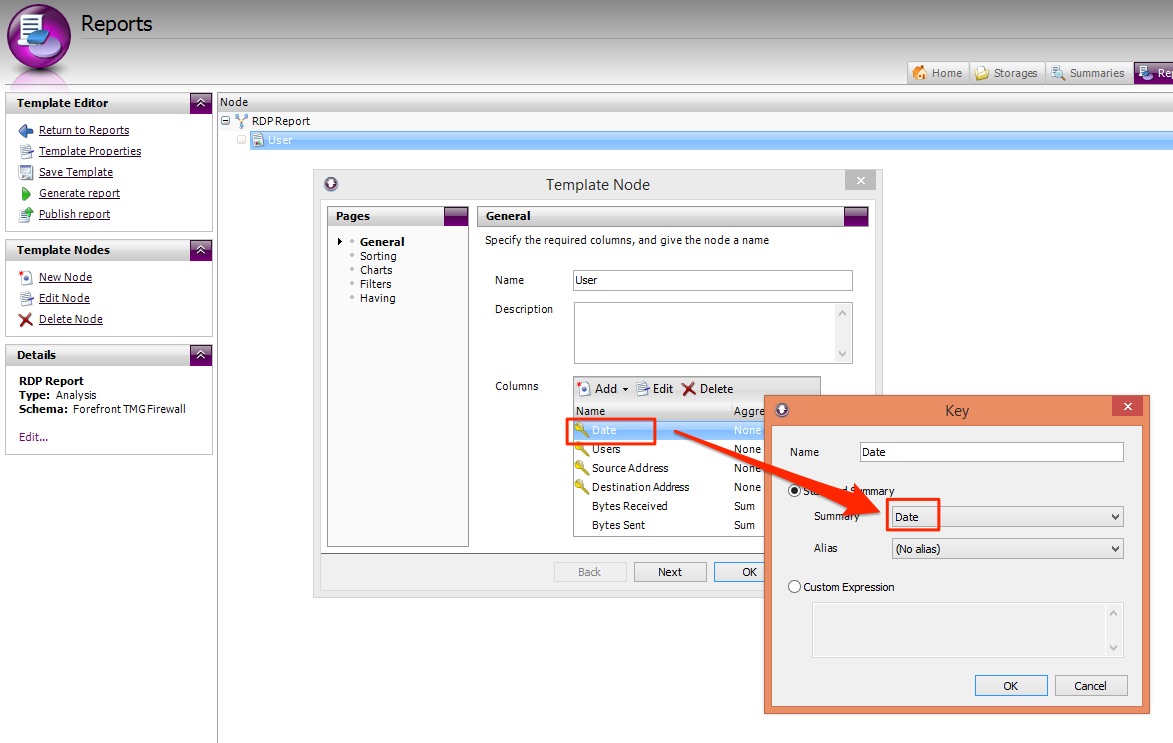
- On the General page, click Add | Key | Summary = Date and push the column up to the very top so that it is the first column in our table (far left).
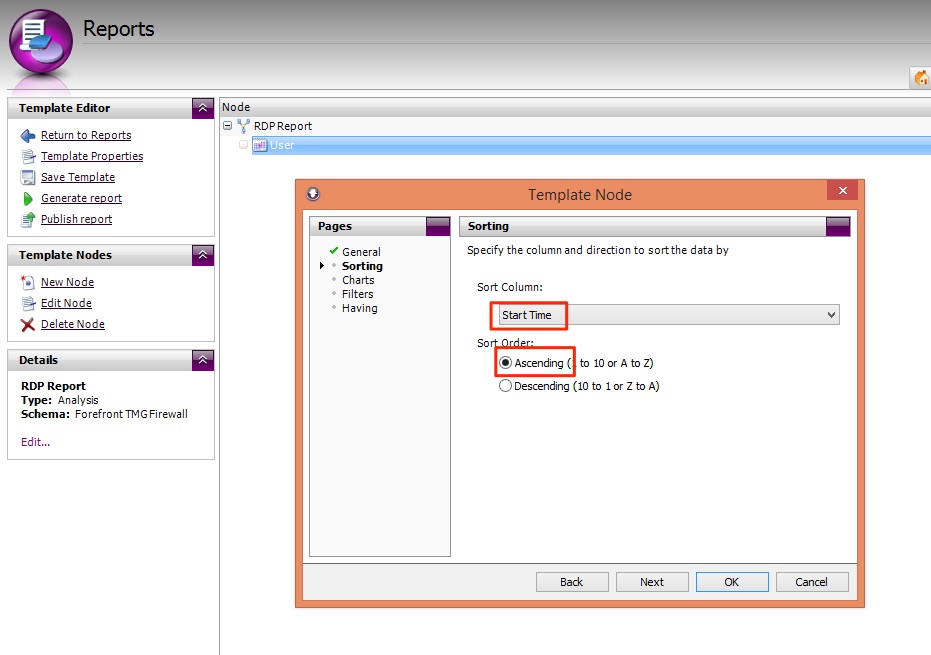
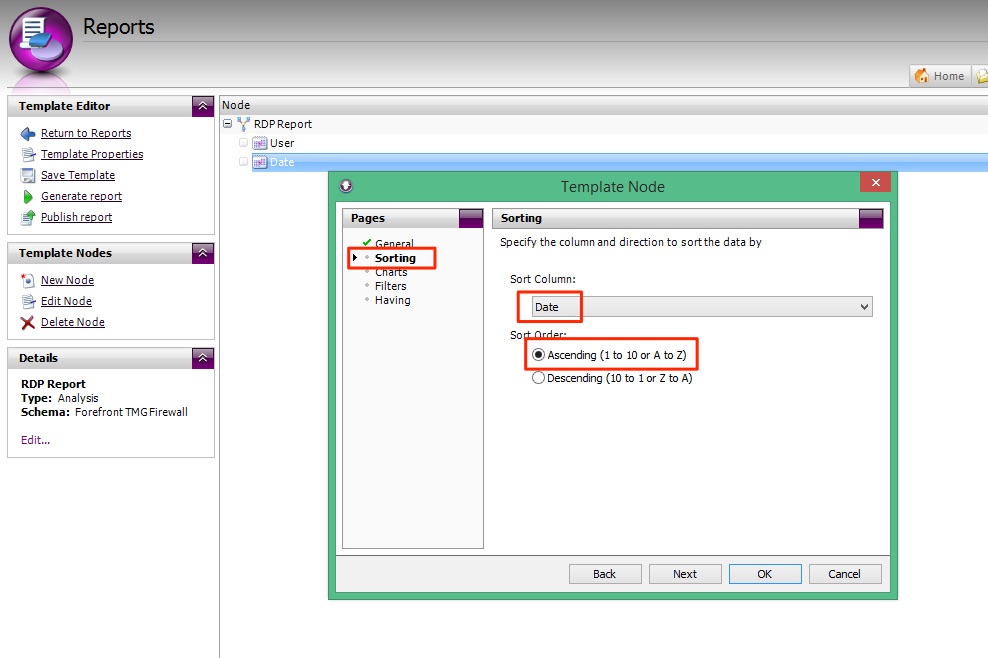
Our node is currently sorted by ‘Connection Time’. Now that we’ve added a Date column, it makes sense to sort our table chronologically. Therefore, I’m going to change the Sorting to use the new Start Time column.
To do this, go to the Sorting page and select Sort Column = Start Time, and change the Sort Order to Ascending.
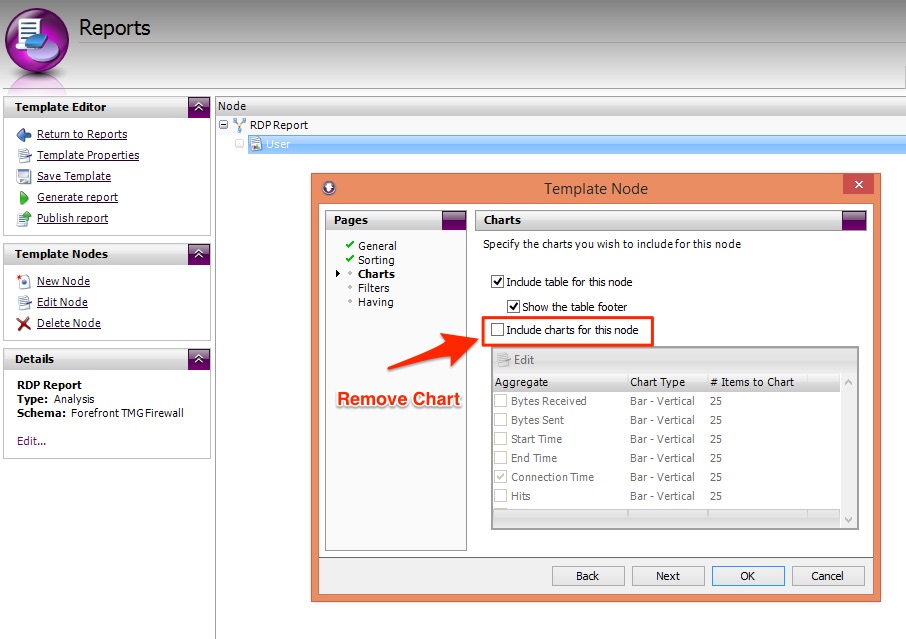
Now let’s remove that annoying chart from the node. Go to the Charts page and uncheck the Include charts for this node option.
With those modifications made, let’s re-run the report again by clicking Generate Report.
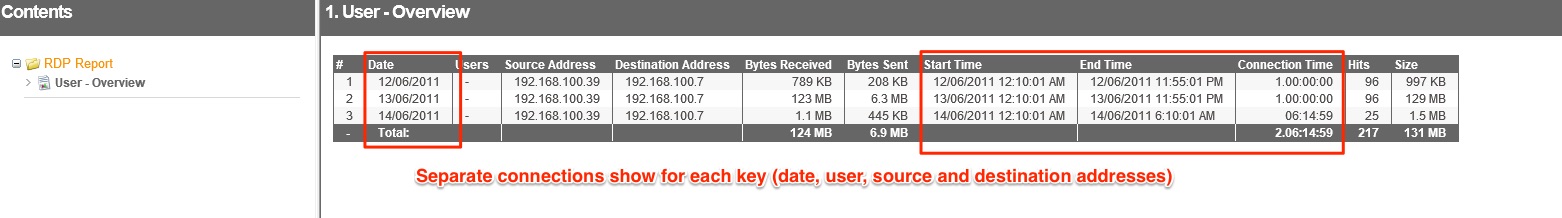
Now we can clearly see the RDP connections start at 12:10:01am on every day, and continue until 11:55:01 pm, except for the 14th when the connection ended at 6:14:59 am. Based on the timestamps, I would say that TMG is recording an RDP event every 5 or 10 minutes, and that I’m really looking at one long connection. It’s unlikely that the user started and stopped an RDP connection at exactly the same time on the 12th and 13th at ridiculous hours of the morning.
Third Modification – Adding Dates by Size Node
I’ve noticed in the table above that there was 129 MB transferred on the 13th, opposed to 997 KB and 1.5 MB on the other days. It would be great to make this more visible by adding a new node to the report with a single key column for Dates with a bar chart that uses the Size column. That way, I could identify the peaks and troughs of RDP connections very easily.
- Once again, edit your Report Template, but this time click New Node.
- Select Summary = Date and Sort by = Date.
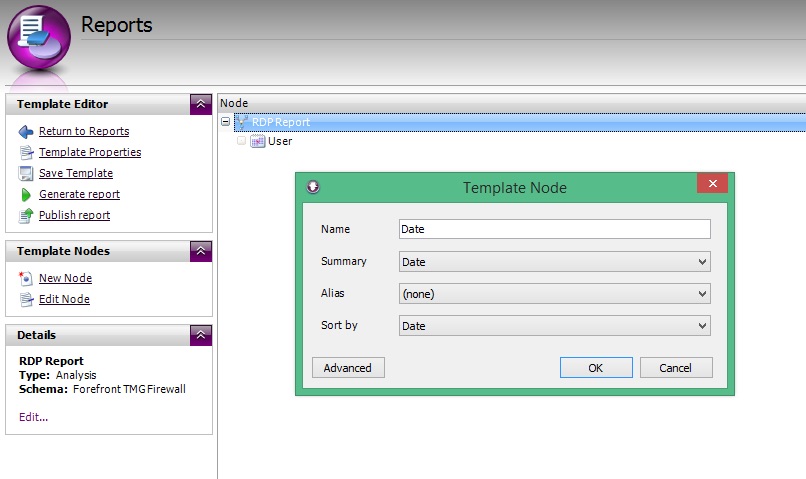
I could just click OK at this stage, but I want to change the sort order to Ascending, so that the earliest date comes first in the table and chart. To do this, click Advanced, then go to Sorting and select Ascending.
Now let’s run the report again by clicking Generate Report.
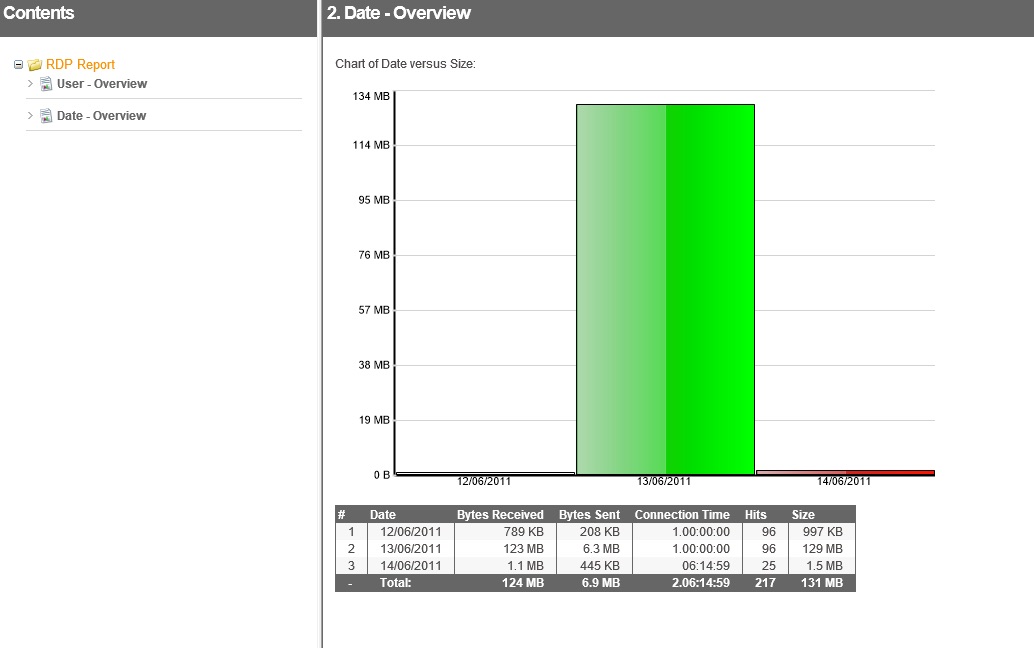
The report has a new section called ‘Date’ showing the size transferred for each date in a nice bar chart. This clearly shows that most data was transferred on the 13th.
Summary
As you can see, WebSpy Vantage provides all the tools you need to aggregate and filter any values from your logs files – in this case RDP connections.
You can Download the Remote Desktop Report Template here, but keep in mind it only works for Forefront TMG Firewall schemas. For other formats, just run through the process above, which will also give you a good understanding on how to use Vantage’s templating engine to achieve your reporting goals. To open the report template, extract the zip to reveal the RDP Report.Template file, then go to Reports | Open Templates and select the file.
I’ve only just scratched the surface in this article. Feel free to add more nodes to show RDP Size per user, or Top Destination IPs by connection time. You could try adding nodes with keys columns for firewall Rules and Actions to show if any RDP sessions are being blocked, and if so, which rule is responsible. Simply customize the key or aggregate columns, sorting and chart settings on each new node as desired.
As the filter for Destination Port = 3389 was added to the Template Properties, every new node you add to this template is automatically filtered by RDP traffic.
Once you have created the report template that you’re happy with, schedule it to be automatically generated and emailed to you each week using the Tasks tab.
I hope this gives you some insight into what is possible with WebSpy Vantage’s report templating engine. If you have any questions or issues, please let us know in our Support Portal, or in the comments below.