Update: The technique described in this series of blog articles has since been improved upon, and integrated into WebSpy Vantage 3.0 via the Origin Domain summary that is present in when analyzing any log files that contain URLs. We’ve called this feature Site Clean. It is also available in our separate Fastvue Reporter applications. See further details about our unique Site Clean engine.
In parts one, two, three and four of this series, we’ve investigated the challenges of reporting on the Modern Web when it comes to employee Internet reports and solved them using Custom Expressions in WebSpy Vantage. Now lets take a look at the results!
Final Custom Expression
In case you missed it in part four, the final custom expression we’re using for the Sensible Sites node is:
iif( ([MimeType] = "text/plain" || [MimeType] = "text/html" || [MimeType] = "text/html;charset=utf-8" || [MimeType] = "text/html; charset=iso-8859-1" ) && ([UrlCategoryName] != 'Web Ads' && [UrlCategoryName] != 'Edge Content Servers/Infrastructure'), domain([Site.Host]), iif( domain([Referrer.Host]) = '' || domain([Referrer.Host]) = '-', domain([Site.Host]), domain([Referrer.Host]) ) )
Charming isn’t it? This takes into account Mime Types, Referrer URLs and URL Categories to associate web resources (such as advertising, visitor tracking, CDNs, social sharing widgets and APIs) with the site the user was actually looking at.
Final Report
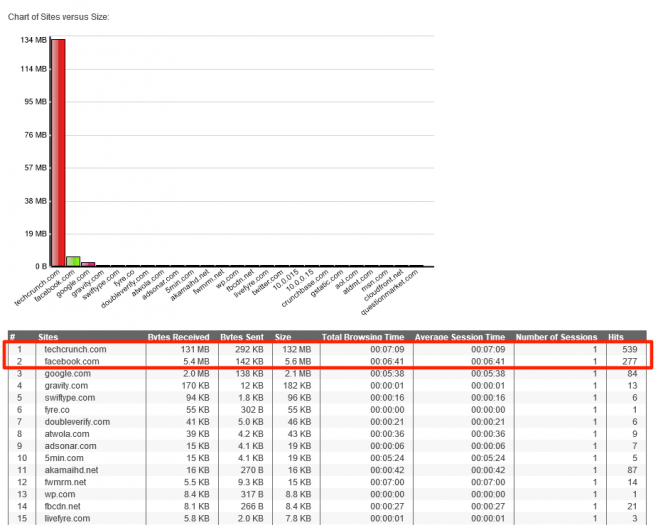
Let’s take a look at the new Sensible Sites summary with the latest Custom Expression above.
As you can see, the actual sites I visited are no longer buried in the 7th and 9th spots.
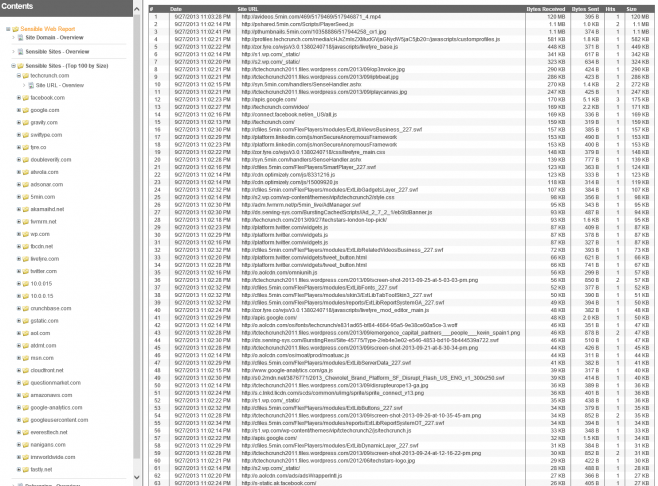
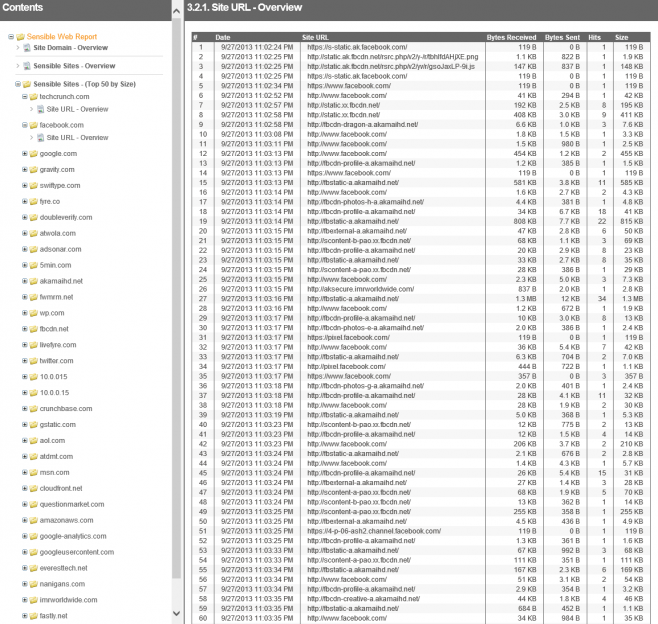
To better see what’s going on, I added a ‘Site URL’ under the Sensible Sites node in the Report Template.
Here are the URLs being grouped into the techcrunch.com Sensible Site:
And here are the URLs being grouped into the facebook.com Sensible Site
Instead of looking at screenshots, feel free to browse around the actual report itself.
You’ll also notice that 5min.com has been reduced from 124 MB down in the original report to just 15 KB, akamaihd.net has gone from 3.3 MB down to 16 KB, and all the other sites have been reduced to less than 200 KB. Google.com is the only other prominent site, as I was also logged into my Gmail account.
Keep in mind, these employee internet report tests have been performed with a small data set and use case. Even though these ‘junk’ sites still appear in the report above, they are now more likely to be ‘drowned out’ in a large production network.
Issues
There are a couple of issues to be aware of with this Custom Expression approach.
IFrames
The ‘Junk’ sites in the report above are due to there being no Referrer URL to display, or the Referrer itself is a Web Ad, Tracker, CDN, Widget or API. This occurs when these web resources pull in additional web resources themselves, which is common with embedded widgets that use IFrames, such as embedded YouTube videos.
For example, if you browse to mashable.com and watch an embedded YouTube video, you will see youtube.com in the Sensible Sites report, not mashable.com.
Unfortunately there is not much we can do for these situations using Custom Expressions, but this an area that WebSpy and Fastvue are looking forward to improving through code.
Performance
As you can imagine, Vantage now has extra work to do to calculate Sensible Sites. This will have a slight affect on memory usage, CPU and the length of time it takes your reports to run.
Other Log Formats
It is important to note that the Custom Expressions in these articles relate only to the Microsoft Forefront TMG Web Proxy schema in WebSpy Vantage. If you’re using a different format such as Cisco IronPort (or any of the other formats mentioned in part three), the names of the fields may be different, as well as the web category names.
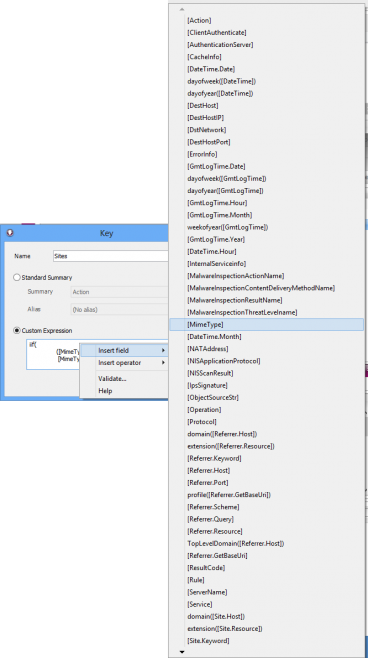
To find the names of your fields, right-click in the Custom Expression edit box and select Insert field. You will then see the full list of fields you can use in your Custom Expression.
To find the URL categories, run an ad-hoc analysis on your storage and go to the Category summary. By glancing through the list of categories, you should be able to find the equivalent ‘Web Ads’ and ‘Edge Content Servers/Infrastructure’ categories.
For example, if you’re analyzing Cisco IronPort’s W3C Access Logs, the equivalent web categories are called Advertisements and Infrastructure and Content Delivery Networks. The expression for Mime Type field is still [MimeType], but the Category expression is [Category] instead of [UrlCategoryName]. The Custom Expression for IronPort W3C Logs would therefore be:
iif(
	(
		[MimeType] = "text/plain" ||
		[MimeType] = "text/html" ||
		[MimeType] = "text/html;charset=utf-8" ||
		[MimeType] = "text/html; charset=iso-8859-1"
	)
	&&
	(
		[Category] != 'Advertisements, ' &&
		[Category] != 'Infrastructure and Content Delivery Networks'
	),
	domain([Site.Host]),
	iif(
		domain([Referrer.Host]) = '' ||
		domain([Referrer.Host]) = '-',
		domain([Site.Host]), domain([Referrer.Host])
	)
)
Summary
Modern web sites are made up of many different components, most of which are hosted on different domains than the one you’re browsing. When analyzing logs from your web gateway, you see all the web requests to these sites and they clutter up your web reports. Some of the top culprits are advertising sites, CDNs, visitor tracking scripts, widgets and API calls.
This five part series has focused on a method we can employ to make sense of all this noise, and how to use Custom Expressions in WebSpy Vantage to implement it.
The method relies on your log format containing the Referrer URL, Mime Type, as well as the original URL.
By replacing the Site nodes in your report templates with the Custom Expression above, you can generate a report that more accurately reflects what sites users were actually going to in their web browser.
The Custom Expression will not completely eradicate these sites from your reports, but will greatly reduce the amount of traffic associated with them. Also be aware that Vantage will utilize more system resources to run reports with this custom expression.
So please go ahead and try out the custom expressions above and let us know how it goes in the comments!
Resources:
Final Report
Browse the final Sensible Web Report.
Vantage Report Templates
Download the Sensible Web Report Templates for Forefront TMG that I used when creating the reports above. The zip file includes two templates. One that drills down into each Sensible Site to show URLs and one without the drilldowns. I recommend using the one without the drilldowns if you’re running the report on a large data set.
Each report template starts with the normal Site Domain section for comparison, and then shows the Sensible Sites section using the last custom expression above. It also has the Debugging section so you can how the ‘Sensible Site’ is being calculated. Please be aware that the Debugging node in these reports will also be very resource intensive on large datasets.
To use the templates:
- Open WebSpy Vantage
- Go to Reports and click Open Templates.
- Select the files in the zip and click Open.
Then go ahead and generate the reports on your storage. You can also Copy/Paste the Sensible Sites node into your other Forefront TMG reports.
See also:
- Making Sensible Employee Internet Reports for the Modern Web (Part 4)
- Making Sensible Employee Internet Reports for the Modern Web (Part 3)
- Making Sensible Employee Internet Reports for the Modern Web (Part 2)
- Making Sensible Employee Internet Reports for the Modern Web (Part 1)
- The Best Way To Report On Websites


